‘Avoidable’ ER Visits Fuel Health Care Costs
New data shows privately insured individuals are unnecessarily using emergency department services.
‘Avoidable’ ER Visits Fuel Health Costs

Getty Images
Two-thirds of 27 million emergency department visits by patients with private insurance each year are "avoidable," a new analysis finds.
The staggering amount of money the U.S. spends on health care each year – expected to reach about $6 trillion by 2027 – is being driven in part by patients who get treatment in hospital emergency departments with problems a primary care doctor likely could solve, according to a data analysis released Monday by UnitedHealth Group.
And while the poor and uninsured may be unable to afford or without access to a primary care doctor, the analysis by the health insurer of its own data and claims found that of 27 million emergency department visits annually by patients with private insurance, two-thirds are "avoidable" and " not an actual emergency. " The average cost of such visits for common conditions that could have been remedied through primary care tops $2,000 .
The problem: an inconvenient and perhaps outdated primary care delivery system that's not always open or accessible when people need immediate treatment.

The Top 10 Causes of Death in the U.S.

"The high number of avoidable hospital ED visits is neither a surprise nor a new problem," says a statement from UnitedHealth Group, headquartered in Minnesota . "Uneven access to timely, consumer-friendly, and convenient primary care options is a longstanding problem, and there is a need to bolster and expand primary care capacity through urgent care centers, physician offices, and nurse practitioners."
According to the analysis of UHG data, privately insured patients show up 18 million times in hospital emergency departments each year in visits that aren't necessary, adding $32 billion a year to national health care costs. Noncritical conditions treated often in EDs include bronchitis, cough, flu, nausea, sore throat, strep throat and upper respiratory infection.
"The average cost of treating common primary care treatable conditions at a hospital ED is $2,032," the analysis says, which is "12 times higher than visiting a physician office ($167) and 10 times higher than traveling to an urgent care center ($193)" for help with those same issues.
The upcharge is partially due to "hospital facility fees, which increase the cost of an average hospital ED visit by $1,069, and lab, pathology, and radiology services, which average $335 at a hospital ED – 10 times more costly than at a physician office ($31)."
Unless the primary care delivery system changes – doctors' offices offer extended, nighttime or weekend hours, or more urgent care clinics open – the problem won't improve, UnitedHealth Group officials say. The nation also needs more medical school graduates to go into general practice, the officials say.
In the meantime, absent better options, health care "consumers will continue to visit EDs for primary-care treatable conditions," the UnitedHealth Group statement says.
Join the Conversation
Tags: hospitals , health care
America 2024

Health News Bulletin
Stay informed on the latest news on health and COVID-19 from the editors at U.S. News & World Report.
Sign in to manage your newsletters »
Sign up to receive the latest updates from U.S News & World Report and our trusted partners and sponsors. By clicking submit, you are agreeing to our Terms and Conditions & Privacy Policy .
You May Also Like
The 10 worst presidents.
U.S. News Staff Feb. 23, 2024

Cartoons on President Donald Trump
Feb. 1, 2017, at 1:24 p.m.

Photos: Obama Behind the Scenes
April 8, 2022

Photos: Who Supports Joe Biden?
March 11, 2020

Protests Threaten Campus Graduations
Aneeta Mathur-Ashton May 6, 2024

The ICC, Explained

Judge Warns Trump of Jail
Lauren Camera May 6, 2024

The Fed Leaves Economists Guessing
Tim Smart May 6, 2024

Women, Money and Michael Cohen
Lauren Camera May 3, 2024

Lawmakers Ramp Up Response to Unrest
Aneeta Mathur-Ashton May 3, 2024

Morning Briefing
Summaries of health policy coverage from major news organizations, the cost of unwarranted er visits: $32 billion a year.
A trip to the emergency room is on average 12 times higher than being treated at a physician's office for common ailments, an analysis from UnitedHealth Group found. The claims data showed ailments frequently treated in the emergency room include cough, bronchitis, headache, sore throat, nausea and upper respiratory infection, which may not actually need emergency care.
Houston Chronicle: Unneeded ER Visits Cost Nation's Healthcare $32 Billion Last Year At the heart of the findings are some staggering price differences. For instance, a trip to the emergency room is on average 12 times higher than being treated at a physician's office for common ailments. That translates to $2,032 on average compared to $167. That same trip is also 10 times higher than a visit to urgent care, which on average costs $193. This can be a crucial difference in Texas, where patients continue to be confused between urgent care clinics and the states' hundreds of free-standing emergency rooms, health analysts say. (Deam, 7/24)
U.S. News & World Report: ‘Avoidable’ ER Visits Fuel U.S. Health Care Costs And while the poor and uninsured may be unable to afford or without access to a primary care doctor, the analysis by the health insurer of its own data and claims found that of 27 million emergency department visits annually by patients with private insurance, two-thirds are "avoidable" and "not an actual emergency." The average cost of such visits for common conditions that could have been remedied through primary care tops $2,000.The problem: an inconvenient and perhaps outdated primary care delivery system that's not always open or accessible when people need immediate treatment. (Williams, 7/22)
In other news on health costs —
Kaiser Health News: First Kidney Failure, Then A $540,842 Bill For Dialysis For months, Sovereign Valentine had been feeling progressively run-down. The 50-year-old personal trainer, who goes by “Sov,” tried changing his workout and diet to no avail. Finally, one Sunday, he drove himself to the hospital in the small town of Plains, Mont., where his wife, Jessica, happened to be the physician on call. “I couldn’t stop throwing up. I was just toxic.” (Gold, 7/25)
Kaiser Health News: Your Go-To Guide To Decode Medical Bills In 2018 Kaiser Health News and NPR teamed up to create “Bill of the Month,” a crowdsourced investigative series in which we dissect and explain medical bills you send us. We have received nearly 2,000 submissions of outrageous and confusing medical bills from across the country. Each month we select one bill to thoroughly investigate, often resulting in the bill being resolved soon after the story is published. But what about the large number of Americans who receive surprise medical bills that reporters can’t examine? (7/25)
More Bills Of The Month: Check out KHN's special coverage on surprisingly high medical bills.
More From KFF Health News

Could Better Inhalers Help Patients, and the Planet?

Stranded in the ER, Seniors Await Hospital Care and Suffer Avoidable Harm

Bird Flu Is Bad for Poultry and Dairy Cows. It’s Not a Dire Threat for Most of Us — Yet.

Journalists Delve Into Climate Change, Medicaid ‘Unwinding,’ and the Gap in Mortality Rates
Thank you for your interest in supporting Kaiser Health News (KHN), the nation’s leading nonprofit newsroom focused on health and health policy. We distribute our journalism for free and without advertising through media partners of all sizes and in communities large and small. We appreciate all forms of engagement from our readers and listeners, and welcome your support.
KHN is an editorially independent program of KFF (Kaiser Family Foundation). You can support KHN by making a contribution to KFF, a non-profit charitable organization that is not associated with Kaiser Permanente.
Click the button below to go to KFF’s donation page which will provide more information and FAQs. Thank you!
- Pharma & Life Sciences
- Digital Transformation
- Cybersecurity
- Patient Experience
Targeted Interventions to Reduce Unnecessary ER Utilization, Lower Costs, and Improve Outcomes

The overutilization of emergency room (ER) services for non-emergency cases has long been an issue. For decades it has contributed to rising healthcare costs and overcrowding, negatively affecting access to care for patients with true emergencies . According to a National Hospital Ambulatory Medical Care survey , there were 131.3 million visits to the ER. Anywhere from 13 percent to 70 percent of those visits were potentially avoidable. These visits cost insurance payers and self-funded employers billions of dollars each year.
Unnecessary ER utilization can also negatively impact those seeking emergency care. It increases wait times and can expose people to infectious diseases in overcrowded waiting rooms. Patients seeking care in the ER often face high out-of-pocket costs, and these visits can result in fragmented healthcare experiences with suboptimal outcomes.
Understanding the Problem
Some people use the ER as their primary source of healthcare due to various barriers, including limited access to primary care providers (PCPs), inadequate health literacy, or cost. Others use the ER for non-life-threatening conditions because they perceive care quality in this setting to be better or don’t understand what constitutes an emergency. Still, others unnecessarily visit the ER because it’s the only available place to get care when needed, or they are unaware of alternate options nearby. The ability to reduce avoidable visits begins with a clear understanding of why patients or members show up in emergency rooms.
According to Cedar Gate Technologies’ healthcare benchmark database of 12 million member lives, top drivers for avoidable ER visits in a commercially insured population include:
- Upper respiratory infections
- Urinary tract infections (UTIs)
These conditions – along with many other avoidable conditions – could often be treated more effectively outside the ER in an urgent care or primary care setting. Diagnosing the Source: Targeted Interventions
With a more in-depth understanding of the reasons for potentially avoidable ER visits, organizations can engage in targeted interventions to modify utilization patterns. Effective strategies can lower costs and improve patient outcomes – key tenets of value-based care programs. Practical and actionable interventions include:
- Enhancing Non-Emergency-Care Access: Some people choose the ER for non-emergency care because it’s the only point of access available – or the only one they know about. Strategies such as increasing the number of primary care providers, extending clinic hours, implementing telehealth services, and promoting urgent care centers can offer patients alternative options that cost significantly less. Additionally, community health programs and educational campaigns can raise awareness about appropriate healthcare utilization.
- Leveraging Data to Guide Informed Decision-Making: Payers and employers need efficient data management and user-friendly analytics tools to identify the drivers of unnecessary ER visits and the levers to correct them. Integrating care coordination technology with analytics enables purchasers to act on the insights with programs designed to reduce ER utilization. When analytics and care coordination are connected through a common data layer, organizations can implement effective programs that support patients’ health and the financial objectives of the enterprise.
- Offering Education to Improve Health Literacy: Poor health literacy remains a key reason people go to the ER for avoidable reasons. Educating people through public health campaigns, community outreach programs, and other initiatives helps them better discern what is actually an emergency and seek out appropriate care settings. Analytics tools with insights into areas with the highest potential for low health literacy (by incorporating data from the Area Deprivation Index , for example) can inform strategies for impactful and cost-effective outreach.
- Implementing New Insurance and Reimbursement Policies: Studies show that some patients choose the more expensive ER because they will not incur upfront costs and can delay payment. Using healthcare benefits analytics tools to reevaluate insurance plan designs and reimbursement policies can incentivize appropriate healthcare utilization. For example, implementing cost-sharing measures, adjusting co-pays based on care settings, and providing financial incentives for primary care utilization can guide patients toward more suitable clinical settings. Healthcare benefits analytics tools help employers and payers model the effects of these changes prior to implementation and choose the ones with the biggest impact.
Why This Matters Now
As value-based care models become more prevalent in U.S. healthcare, cost reductions and quality improvements that stem from payer-provider collaboration will be increasingly important. Understanding utilization patterns and pinpointing reasons for avoidable ER visits, and in turn developing targeted interventions, is essential for organizations to steer patients away from unnecessary, high-cost ER trips. These insights can only come from comprehensive analytics software that connects seamlessly with care coordination tools.
The right software solutions empower employers, payers, and providers to help patients find the optimal care touch point, streamline pre-authorizations with near-real-time data sharing, invest in patient education, and enhance communication among all providers in a care continuum. The end result is a sustainable reduction in unnecessary ER visits, benefiting patients and the healthcare system.
The author, Ginger Pape, PharmD, is VP of Product Management at Cedar Gate Technologies.
RELATED POSTS

Pioneering Personalized Medicine through AI Collaborations in Healthcare and Pharma

Healthcare Organizations on High Alert: Building Resiliency Against Rising Cyberattacks

The Role of User-Centered Design in Mental Health Technology
Trending now, how governments can improve access to healthcare, how ai is impacting healthcare in 2024, establishing image lifecycle management policies to make the most out of your data, connect with us.

BECOME AN INSIDER
Get future healthcare today insider news and updates in your inbox..
I consent to having Future Healthcare Today collect my email and I agree to the Terms of Service and Privacy Policy .
Strategic Communications Group is a digital media company that helps business-to-business marketers drive customer demand through content marketing, content syndication, and lead identification.
Related Communities
Financial Technology Today Government Technology Insider Modern Marketing Today Retail Technology Insider Today’s Modern Educator
Quick Links
- Home – 2021
Become a Sponsor
Future Healthcare Today offers content and advertising sponsorships to leading healthcare solution and service providers. Interested in becoming a sponsor? Contact us!
© 2023 Strategic Communications Group, Inc. Privacy Policy | Terms of Service
Estimates of Emergency Department Visits in the United States, 2016-2021
The National Hospital Ambulatory Medical Care Survey (NHAMCS), conducted by the National Center for Health Statistics (NCHS), collects annual data on visits to emergency departments to describe patterns of utilization and provision of ambulatory care delivery in the United States. Data are collected from nonfederal, general, and short-stay hospitals from all 50 U.S. states and the District of Columbia, and are used to develop nationally representative estimates.
This visualization depicts both counts and rates of emergency department visits from 2016-2021 for the 10 leading primary diagnoses and reasons for visit, stratified by selected patient and hospital characteristics. Rankings for the 10 leading categories were identified using weighted data from 2021 and were then assessed in prior years; however, rankings were relatively consistent over the evaluated years. See tables in the Definitions section below the visualization for changes in leading primary diagnoses and reasons for visit from 2016-2021. Estimates in this visualization highlight and expand on information provided in the annual NHAMCS web tables , which can be used to assess how these categories and rankings changed over the evaluated years.
Use the tabs at the bottom of the visualization to select between “Primary Diagnosis” and “Reason for Visit”. Use the drop-down menus at the top of the visualization to select the estimate type, the estimate category, and the group breakdown of interest.
Access Dataset on Data.CDC.gov (Export to CSV, JSON, XLS, XML) [?]
Definitions
Based on International Classification of Diseases, 10th Revision, Clinical Modification (ICD–10–CM). See Table 11 of the NHAMCS: 2020 Emergency Department Summary Tables for code ranges of diagnosis categories, available from: https://www.cdc.gov/nchs/data/nhamcs/web_tables/2020-nhamcs-ed-web-tables-508.pdf .
SOURCE: National Center for Health Statistics, National Hospital Ambulatory Medical Care Survey, 2016-2021
Based on the patient’s own words and coded according to: Schneider D, Appleton L, McLemore T. A reason for visit classification for ambulatory care. National Center for Health Statistics. See Appendix II of the 2020 NHAMCS public-use documentation for code ranges of reason categories, available from: https://ftp.cdc.gov/pub/Health_Statistics/NCHS/Dataset_Documentation/NHAMCS/doc20-ed-508.pdf .
Calculated by dividing the number of ED visits by estimates of the U.S. civilian noninstitutionalized population (obtained from the U.S. Census Bureau’s Population Division) for selected characteristics including age, sex, and race and ethnicity. Visit rates for MSA are based on estimates of the U.S. civilian noninstitutionalized population from the National Health Interview Survey, compiled according to the Office of Management and Budget definitions of core-based statistical areas. More information about MSA definitions is available from: https://www.census.gov/programs-surveys/metro-micro.html . Visit rates for patient’s expected source of payment are based on patient’s primary expected source of payment and proportional insurance data from the National Health Interview Survey.
During data collection, all sources of payment were collected. For patients with more than one source of payment, the hierarchy below was used (with Medicare counted first and self-pay and no charge counted last) to collapse payments into one mutually exclusive variable (expected source of payment). Visits that had a missing or unknown expected payment source were excluded (between 10-14% [weighted] from 2016-2021).
- Medicare: Partial or full payment by Medicare plan includes payments made directly to the hospital as well as payments reimbursed to the patient. Charges covered under a Medicare-sponsored prepaid plan are included.
- Medicaid: Partial or full payment by Medicaid plan includes payments made directly to the hospital or reimbursed to the patient. Charges covered under a Medicaid-sponsored prepaid plan (HMO) or “managed Medicaid” are included.
- Private: Partial or full payment by a private insurer (such as BlueCross BlueShield), either directly to the hospital or reimbursed to the patient. Charges covered under a private insurance-sponsored prepaid plan are included.
- Uninsured: Includes self-pay and no charge or charity. Self-pay are charges paid by the patient or patient’s family that will not be reimbursed by a third party. Self-pay includes visits for which the patient is expected to be responsible for most of the bill, even if the patient never actually pays it. This does not include copayments or deductibles. No charge or charity are visits for which no fee is charged (such as charity, special research, or teaching).
- Other: Includes Worker’s Compensation and other sources of payment not covered by the above categories, such as TRICARE, state and local governments, private charitable organizations, and other liability insurance (such as automobile collision policy coverage).
Race and Hispanic ethnicity were collected separately and converted into a single combined variable that includes non-Hispanic White, non-Hispanic Black, Hispanic, and non-Hispanic other people. Non-Hispanic other people includes Asian, Native Hawaiian or Other Pacific Islander, and American Indian or Alaska Native people, and people with two or more races. Missing values for race and ethnicity were imputed as described in the 2019 NHAMCS public-use documentation, available from: https://ftp.cdc.gov/pub/Health_Statistics/NCHS/Dataset_Documentation/NHAMCS/doc19-ed-508.pdf .
Please send comments or questions to [email protected] .
Data Source
National Center for Health Statistics, National Hospital Ambulatory Medical Care Survey, 2016-2021
Suggested Citation
National Center for Health Statistics. Emergency Department Visits in the United States, 2016-2021. Generated interactively: from https://www.cdc.gov/nchs/dhcs/ed-visits/index.htm
Exit Notification / Disclaimer Policy
- The Centers for Disease Control and Prevention (CDC) cannot attest to the accuracy of a non-federal website.
- Linking to a non-federal website does not constitute an endorsement by CDC or any of its employees of the sponsors or the information and products presented on the website.
- You will be subject to the destination website's privacy policy when you follow the link.
- CDC is not responsible for Section 508 compliance (accessibility) on other federal or private website.
- Download PDF
- Share X Facebook Email LinkedIn
- Permissions
Medicaid Expansion and Avoidable Emergency Department Use—Implications for US National and State Government Spending
- 1 School of Medicine, Department of Emergency Medicine, University of Washington, Seattle
- 2 School of Public Health, Department of Health Systems and Population Health, University of Washington, Seattle
- 3 Evans School of Public Policy & Governance, University of Washington, Seattle
- Original Investigation Association of Medicaid Expansion With Emergency Department Visits by Medical Urgency Theodoros V. Giannouchos, PhD, MS; Benjamin Ukert, PhD; Christina Andrews, PhD JAMA Network Open
Expansion of Medicaid through the Affordable Care Act has been one of the most consequential health and social program reforms in recent decades. Since 2014, approximately 14 million low-income US individuals, most of whom were uninsured before, have gained health insurance coverage through Medicaid expansion alone. 1 Beyond increasing health insurance enrollments, Medicaid expansion has resulted in a net savings for participating states overall (largely owing to enhanced federal cost-sharing) and numerous economic and health benefits for enrollees. 2 However, there are lingering concerns about the ramifications of using a publicly funded coverage mechanism for a large proportion of the population for state and federal budgets.
A crucial question for many policy makers is whether Medicaid expansion offers value over alternative pathways to expand coverage, such as greater investment in subsidized insurance exchanges. However, answering this question largely hinges on the extent to which Medicaid expansion improves the efficiency of health care use and spending. Giannouchos and colleagues 3 examine whether Medicaid expansion was associated with improvements in the use of what is often one of the most expensive health care settings: the emergency department (ED). Their simple yet revealing study further contributes to the literature by noting that Medicaid expansion is a good value for states and is likely to reap long-term benefits in the form of better population health and lower health care spending.
In this study, the authors examined 80.6 million outpatient ED visits from the Healthcare Cost and Utilization Project State Emergency Department Databases and a difference-in-differences design to evaluate changes in the rate of outpatient ED use in 2 Medicaid expansion states (New York and Massachusetts) vs 2 nonexpansion states (Georgia and Florida) from 2011 to 2017. 3 Emergency department visits were stratified by severity using the New York University algorithm, which classifies visits based on their likelihood that the primary diagnosis will fall into 1 of 4 subgroups: (1) emergent, not preventable, (2) emergent but potentially preventable, (3) emergent but primary care treatable, and (4) nonemergent. Emergency department visits related to injuries and behavioral health conditions are also classified (or classified separately). Although no clear consensus exists on what proportion of ED visits are unnecessary, it is generally believed that a substantial number could be avoided with either better access to timely and high-quality ambulatory care (such as in the case of preventing exacerbations of chronic illness), greater attention to mitigating social determinants of health or, at least, shifting care to a less costly venue (such as an urgent care center).
The investigators found that Medicaid expansion was associated with a significant reduction in overall ED use by 4.7 visits per 1000 population. 3 Furthermore, this reduction was associated largely with changes in the subgroups of ED visits that are potentially avoidable, with greater decreases noted for the least severe conditions that are likely to be most avoidable and smaller decreases for higher severity conditions. Visits classified as nonemergent decreased by 1.5 visits per 1000 population, those classified as primary care treatable declined by 1.1 visits per 1000 population, and those classified as emergent, but potentially preventable declined by 0.3 visits per 1000 population (all statistically significant declines). Conversely, the authors noted no associations with visits classified as injuries and emergent, not preventable, which would not be expected to change owing to insurance coverage alone. Although the present study was limited to ED use, the apparent disproportionate reductions in nonemergent and primary care–treatable conditions are highly suggestive of greater access to alternative and less-costly sources of care. Accordingly, these results are largely consistent with the preponderance of studies that show increased access to preventive care, better continuity of care and management of chronic disease, and an overall decrease in unmet health care needs among low-income adults in states that expanded Medicaid vs those that did not. 4 , 5
Reducing unnecessary ED use has been a longstanding priority for state policy makers. Medicaid enrollees use the ED at higher rates than those with private insurance or who are uninsured. 6 Although Medicaid coverage clearly improves access to essential services relative to having no insurance, many Medicaid enrollees still experience persistent barriers in accessing high-quality and coordinated services and face poor social determinants of health, both of which are associated with avoidable ED use. Moreover, unlike private insurance, most Medicaid programs do not impose cost-sharing requirements for health care services used by enrollees, which lowers the opportunity cost for using the ED for Medicaid enrollees compared with individuals with private coverage. This situation may be why many studies on Medicaid coverage expansions demonstrate increased ED use. For example, the Oregon Health Insurance Experiment, a randomized clinical trial under which Medicaid coverage was expanded via lottery to a subset of low-income individuals in Oregon, found that ED visits increased by 40% in the first year and a half following enrollment. 7 It is, therefore, understandable that the outcomes of the ACA’s Medicaid expansion on ED use have been an area of intense study.
Although Giannouchos et al 3 found encouraging patterns of ED use, other studies have found the opposite. In particular, a 2019 study by Garthwaite et al, 8 which also used Healthcare Cost and Utilization Project data, but included 20 states and all ED visits (both outpatient ED visits as well as those leading to inpatient admission), found that ED use for deferrable conditions increased in expansion states relative to nonexpansion states, whereas those for nondeferrable conditions did not. The authors defined deferrable conditions as those that a panel of physicians believed were likely to be at the patient’s discretion, and nondeferrable conditions as those that were truly emergent and not likely to be discretionary. This latter study only examined data through 1 year postexpansion and, thus, may have observed an early uptick in ED use owing to pent-up demand. The study by Giannouchos et al 3 incorporates a 4-year time horizon but a more limited set of states, which could explain the variable results.
So, where does this study leave us on the question of whether Medicaid expansions improve value for states with respect to ED use? It appears that for some states, expanding Medicaid improves the efficiency ED use, resulting in fewer ED visits for conditions that may be prevented with better access to primary care. In other states, especially those that may have less ambulatory capacity to meet increased demand from newly enrolled Medicaid beneficiaries, ED visits may increase (at least initially). However, it is important to consider that better access to care and management of chronic disease may take years to manifest in the form of improved health and lower rates of avoidable ED visits. As a result, the long-term outcomes of Medicaid expansion associated with avoidable ED use should remain an area of ongoing inquiry as a meaningful indicator of the effectiveness of the ambulatory care system for Medicaid enrollees, as well as the overall health of the Medicaid population.
Published: June 14, 2022. doi:10.1001/jamanetworkopen.2022.16917
Open Access: This is an open access article distributed under the terms of the CC-BY License . © 2022 Sabbatini AK et al. JAMA Network Open .
Corresponding Author: Amber K. Sabbatini, MD, MPH, School of Medicine, Department of Emergency Medicine, University of Washington, 1705 NE Pacific St, Box 357235, Seattle, WA 98195 ( [email protected] ).
Conflict of Interest Disclosures: None reported.
See More About
Sabbatini AK , Dugan J. Medicaid Expansion and Avoidable Emergency Department Use—Implications for US National and State Government Spending. JAMA Netw Open. 2022;5(6):e2216917. doi:10.1001/jamanetworkopen.2022.16917
Manage citations:
© 2024
Select Your Interests
Customize your JAMA Network experience by selecting one or more topics from the list below.
- Academic Medicine
- Acid Base, Electrolytes, Fluids
- Allergy and Clinical Immunology
- American Indian or Alaska Natives
- Anesthesiology
- Anticoagulation
- Art and Images in Psychiatry
- Artificial Intelligence
- Assisted Reproduction
- Bleeding and Transfusion
- Caring for the Critically Ill Patient
- Challenges in Clinical Electrocardiography
- Climate and Health
- Climate Change
- Clinical Challenge
- Clinical Decision Support
- Clinical Implications of Basic Neuroscience
- Clinical Pharmacy and Pharmacology
- Complementary and Alternative Medicine
- Consensus Statements
- Coronavirus (COVID-19)
- Critical Care Medicine
- Cultural Competency
- Dental Medicine
- Dermatology
- Diabetes and Endocrinology
- Diagnostic Test Interpretation
- Drug Development
- Electronic Health Records
- Emergency Medicine
- End of Life, Hospice, Palliative Care
- Environmental Health
- Equity, Diversity, and Inclusion
- Facial Plastic Surgery
- Gastroenterology and Hepatology
- Genetics and Genomics
- Genomics and Precision Health
- Global Health
- Guide to Statistics and Methods
- Hair Disorders
- Health Care Delivery Models
- Health Care Economics, Insurance, Payment
- Health Care Quality
- Health Care Reform
- Health Care Safety
- Health Care Workforce
- Health Disparities
- Health Inequities
- Health Policy
- Health Systems Science
- History of Medicine
- Hypertension
- Images in Neurology
- Implementation Science
- Infectious Diseases
- Innovations in Health Care Delivery
- JAMA Infographic
- Law and Medicine
- Leading Change
- Less is More
- LGBTQIA Medicine
- Lifestyle Behaviors
- Medical Coding
- Medical Devices and Equipment
- Medical Education
- Medical Education and Training
- Medical Journals and Publishing
- Mobile Health and Telemedicine
- Narrative Medicine
- Neuroscience and Psychiatry
- Notable Notes
- Nutrition, Obesity, Exercise
- Obstetrics and Gynecology
- Occupational Health
- Ophthalmology
- Orthopedics
- Otolaryngology
- Pain Medicine
- Palliative Care
- Pathology and Laboratory Medicine
- Patient Care
- Patient Information
- Performance Improvement
- Performance Measures
- Perioperative Care and Consultation
- Pharmacoeconomics
- Pharmacoepidemiology
- Pharmacogenetics
- Pharmacy and Clinical Pharmacology
- Physical Medicine and Rehabilitation
- Physical Therapy
- Physician Leadership
- Population Health
- Primary Care
- Professional Well-being
- Professionalism
- Psychiatry and Behavioral Health
- Public Health
- Pulmonary Medicine
- Regulatory Agencies
- Reproductive Health
- Research, Methods, Statistics
- Resuscitation
- Rheumatology
- Risk Management
- Scientific Discovery and the Future of Medicine
- Shared Decision Making and Communication
- Sleep Medicine
- Sports Medicine
- Stem Cell Transplantation
- Substance Use and Addiction Medicine
- Surgical Innovation
- Surgical Pearls
- Teachable Moment
- Technology and Finance
- The Art of JAMA
- The Arts and Medicine
- The Rational Clinical Examination
- Tobacco and e-Cigarettes
- Translational Medicine
- Trauma and Injury
- Treatment Adherence
- Ultrasonography
- Users' Guide to the Medical Literature
- Vaccination
- Venous Thromboembolism
- Veterans Health
- Women's Health
- Workflow and Process
- Wound Care, Infection, Healing
Get the latest research based on your areas of interest.
Others also liked.
- Register for email alerts with links to free full-text articles
- Access PDFs of free articles
- Manage your interests
- Save searches and receive search alerts
- What Sets It Apart
- Applications
- Global Usage
- License Types
- News & Announcements
- ACG System Knowledge Base
- Resource Library v13.0
- System Documentation
- Bibliography
- User Conferences
- Meet the Team
- Barbara Starfield
- Update / SIgnout
- 2009 Conference Presentations
- 2010 ACG Conference
- 2010 London Symposium
- 2011 Asia Pacific Conference
- 2012 ACG Conference
- 2012 Avignon PCSI
- 2012 London Symposium
- 2013 Perdido Beach
- 2013 WONCA Prague Conference
- 2014 JHU International ACG User
- 2014 London Symposium
- 2015 AcademyHealth Award
- 2015 Hartford Training
- 2016 ACG Conference San Diego
- 2017 London Symposium
- 2017 Puerto Rico Training Conference
- 2017-2018 Webinar Series
- 2018 International Conference San Antonio
- 2018 Leicester Symposium
- 2019 Indian Wells Training
- 2019 London Symposium
- ACG System 10.0.1i Download
- ACG System 9.0i Download
- ACG System Public Documentation
- ACG System x.xi Mapping Files 1
- ACG® System Tutorial Video Library
- Case Studies
- Download The ACG System Software (Non-USA)
- Download The ACG System Software v12.0
- Download The ACG System Software v12.1
- Presentations
- Public Access
- Readmissions White Paper
- System Downloads
- Training Material
- Version 10.0
- Version 10i Training
- Version 11.0
- Version 11.1
- Version 11.2
- Version 12.0
- Version 12.1
- Version 8.2 – 8.2i
- Version 9.0
- White Papers
- Sort Results By Newest Oldest Alphabetical Popularity
Register for access to ACG System website content, newsletter & other communications
POPULATION HEALTH ANALYTICS
A plan of action to reduce avoidable ed visits, june 1st, 2021 | emergency department classification | population health management & improvement.

In our latest blog series, we’ll be taking a look at how the ACG System’s suite of tools can be used to understand emergency department (ED) visits and in turn, optimize health care utilization and reduce potential costs.
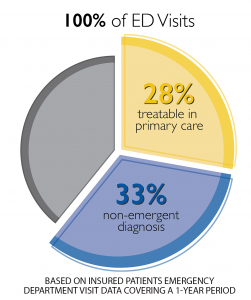
If you read last week’s blog , you know that the ACG System can reveal specific trends in ED visits for a certain population, specifically, patients who visited for non-emergent care or primary care (PCP) treatable conditions. By drilling down into this data, ACG System users can understand root causes of ED use and segment patients into groups depending on their unique health care needs. With this information in hand, System users can develop an effective strategy to reduce ED use and associated health care costs.
Following a detailed, ACG-driven analysis and plan, System users can use granular patient-level outputs to develop and deploy tactics to reduce potentially-avoidable ED visits. Patients with multiple ED visits for PCP-treatable diagnoses may benefit from outreach from their PCP, or assistance locating and working with a PCP if they do not have an existing relationship. The organization may wish to assess systemic access barriers as well, such as transportation challenges, PCP office hours/appointment availability, or prohibitively high co-pay for a PCP visit.
Another impactable patient group are those visiting ED departments for non-emergent diagnoses. ACG System users can identify and target relatively healthy patients (those with lower RUB* levels, for instance) with educational campaigns and incentives for PCP visits. Likewise, individuals with more complex needs, multiple chronic conditions, or care coordination challenges (RUB 4 or 5) can be directed to targeted preventive services and guidance from their PCP. The ability to tailor a specific approach to a specific group of patients maximizes impact while meeting patient-specific care needs.
The diagram below shows how the ACG System can segment a general set of data (avoidable ED visits) into its various, specific components. With each level of segmentation, the data filters into more and more precise groups, who can be targeted for specific interventions.
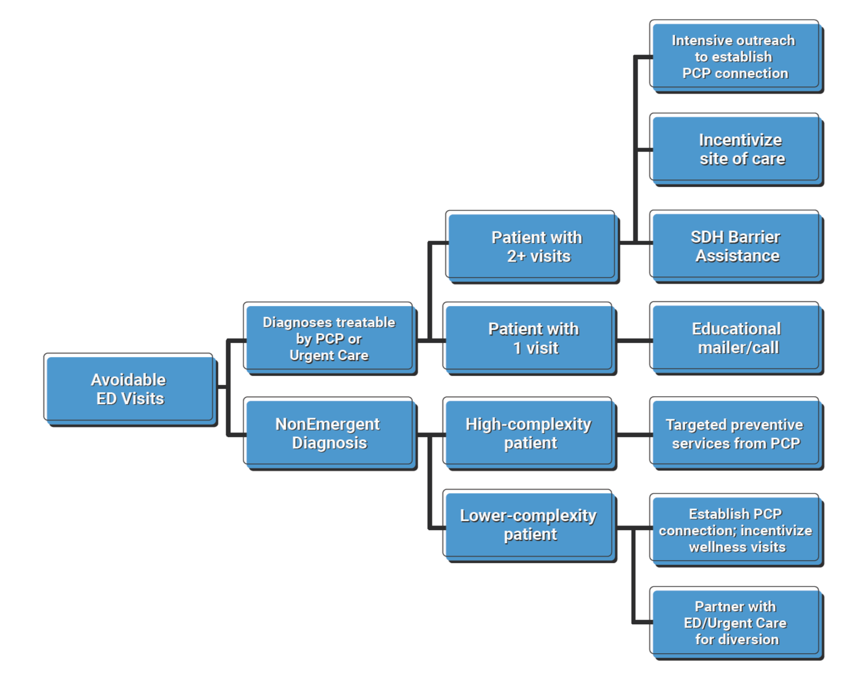
Ultimately, when ACG System users understand causes and trends in ED use at this granular level, they can proactively target patients with potentially-avoidable visits and deploy interventions to reduce avoidable ED use. The result? Improved access to PCPs and lower unnecessary ED visits.
*RUB = Resource Utilization Band, a category of expected health (care need as defined by the ACG System (1 = low; 5 = high)
Want to take an even deeper dive into how the ACG System can help classify your ED visit data? Read a case study from Israel’s Clalit Health Services here.
Sign up for blog alerts and other insights from the ACG System team
- Hidden Name
- First Name *
- Last Name *
- Organization Name *
- Market Segment Other Employer Government / public sector Health Care Provider Health Insurance Plan IT / analytics Pharmaceutical Company Research Institution
- Hidden Compliance
- Hidden Owner ID (Alan)
- Hidden Owner ID (John)
- Hidden Lead Product
- Hidden Lead Source ACG Website
- Send me emails, blog alerts and other insights about population health analytics
- Contact me about how the ACG System can benefit my organization.
This site is protected by reCAPTCHA and the Google Privacy Policy and Terms of Service apply.
- Name This field is for validation purposes and should be left unchanged.
April 11th, 2024
March 14th, 2024, february 15th, 2024, january 18th, 2024, november 30th, 2023.
Copyright 2024, The Johns Hopkins University. All rights reserved.

© The Johns Hopkins University, The Johns Hopkins Hospital, and Johns Hopkins Health System. All rights reserved. Terms of Use Privacy Statement
- Center on Health Equity and Access
- Health Care Cost
- Health Care Delivery
- Value-Based Care
Incidence and Cost of Potentially Avoidable Emergency Department Visits for Urolithiasis
- James Frisbie, MD
- Charles D. Scales Jr, MD, MSHS
- Matthew E. Nielsen, MD, MS
- David F. Friedlander, MD, MPH
This study characterizes the incidence and associated factors of urolithiasis-related emergency department visits that are potentially preventable with appropriate ambulatory care and calculates their cumulative costs.
Objectives: Urolithiasis represents a leading cause of emergency department (ED) presentation nationally, affecting approximately 10% of Americans. However, most patients require neither hospital admission nor surgical intervention. This study investigates patient and facility factors associated with potentially avoidable ED visits and their economic consequences.
Study Design: Retrospective analysis.
Methods: Patients presenting to the ED for index urolithiasis events were selected using Florida and New York all-payer data from the 2016 Healthcare Cost and Utilization Project state databases. Avoidable visits were defined as subsequent ED encounters following initial ED presentation that did not result in intervention, admission, or referral to an acute care facility. Utilizing multivariable logistic and linear regression, researchers discerned patient and facility factors predictive of avoidable ED presentations and associated costs.
Results: Of the 167,102 ED encounters for urolithiasis, 7.9% were potentially avoidable, totaling $94,702,972 in potential yearly cost savings. Mean encounter-level costs were higher for unavoidable vs avoidable visits ($5885 vs $2098). In contrast, mean episode-based costs were similar for avoidable and unavoidable episodes ($7200 vs $7284). Receiving care in small metropolitan (vs large metropolitan) communities was associated with potentially avoidable visits, whereas increased comorbidities and Hispanic ethnicity were protective against avoidable visits.
Conclusions: The incidence of ED use for subsequent urolithiasis care reveals opportunity for enhanced outpatient availability to reduce hospital-based costs. Several nonclinical factors are associated with potentially avoidable ED visits for urolithiasis, which, if appropriately targeted, may represent an opportunity to reduce health care spending without compromising the quality of care delivery.
Am J Manag Care. 2023;29(11):e322-e329. https://doi.org/10.37765/ajmc.2023.89458
Takeaway Points
Given the incidence of urolithiasis as a top contributor to emergency department presentations, this study explores what proportion of visits may have been safely conducted in outpatient or urgent care settings and their associated costs.
- Annual costs of potentially avoidable visits for urolithiasis total more than $94 million in New York and Florida.
- Our findings support investment in outpatient diagnostic and procedural alternatives to divert patients to lower-acuity care settings.
- Management of urinary calculus disease may be amenable to care standardization measures such as bundled payment models to reduce variation in intensity/cost of clinical care.
Renal colic, commonly caused by urolithiasis (also known as urinary stones), accounts for approximately 2 million emergency department (ED) presentations per year and contributes approximately $10 billion to annual US health expenditures. 1,2 Although the severity of underlying disease and subsequent care pathways vary significantly, virtually all index stone encounters occur in the ED and are often associated with imaging studies that introduce significant cost. 3-5 The high prevalence of urinary stone disease—identified in approximately 10% of American adults annually—and severity of associated pain symptoms contribute to high ED presentation rates, with renal colic ranking within the top 10 most common conditions treated in US EDs. 6,7
However, less than 10% of patients presenting to EDs for urolithiasis require hospitalization, and outpatient workup is often available in sufficiently resourced communities. 8 Both ED and outpatient management consists largely of analgesic and antiemetic medications for symptomatic alleviation, some of which are available as oral formulations and accessible outside hospital-based settings; further, less than a quarter of cases warrant antibiotics. 9 Traditionally, avoidable ED presentations often represent 1 of 2 types of conditions: (1) acute presentations of chronic conditions for which effective outpatient management may prevent these exacerbations and (2) presentations of conditions for which outpatient management is often available. 10 Through a more comprehensive view of preventable ED usage, current literature describes a pathway of events leading up to a potentially avoidable admission, where intervention at any point along the pathway may avoid reliance on ED resources. 11 Within this more comprehensive framework of avoidable ED usage, 12 we hypothesize that certain ED presentations for urinary stone disease, such as in patients with a previous diagnosis of urolithiasis, may be amenable to outpatient management. Consequently, developing standardized, ambulatory-based care pathways may represent an effective strategy to shift care for urinary stone disease to outpatient settings and, in doing so, reduce costs without compromising care. Although not traditionally considered an ambulatory care–sensitive condition—a set of conditions for which effective and timely outpatient management could theoretically prevent hospitalization 13 —urolithiasis may share features of these conditions.
Such an approach is particularly appealing in the context of recent US policy efforts to move away from traditional fee-for-service models toward alternative payment methods for discrete episodes of care. 14 Unfortunately, there are limited data on the incidence of potentially avoidable ED visits for urinary stone disease, much less predictors of these episodes and the cost savings borne by redirecting patients toward the ambulatory setting for the treatment of urolithiasis. In this context, we use all-payer claims data to identify urolithiasis presentations to the ED following an index encounter that did not result in inpatient admission or procedural intervention. Although these presentations are not uniformly preventable, we aim to categorize them as “potentially avoidable” to denote a group of patients of whom a certain portion may theoretically have been safely managed in the outpatient setting, thereby avoiding cost-intensive emergency services. We aimed to identify patient factors and costs associated with potentially avoidable ED visits for stone events. We hypothesize that both clinical (eg, comorbidity status) and nonclinical (eg, socioeconomic status) drivers influence rates of avoidable ED visits for urolithiasis.
Data Source
This study utilized the 2016 Healthcare Cost and Utilization Project (HCUP) state emergency department databases from Florida and New York. HCUP is a collection of national and state health care databases containing all-payer, encounter-level data sponsored through the Agency for Healthcare Research and Quality. 15 Florida and New York were selected for analysis because they represent 2 of the largest, most socioeconomically diverse states that contain patient-specific identification numbers that track patients across care settings over the calendar year.
Study Population
International Classification of Diseases, Tenth Revision, Clinical Modification ( ICD-10-CM ) codes ( eAppendix Table [ available at ajmc.com ]) were used to identify patients 18 years and older presenting to the ED for an index episode of acute urolithiasis between January 1, 2016, and December 31, 2016. 16,17 Index episodes were defined as the first encounter at a hospital-affiliated ED for a diagnosis of urolithiasis over a calendar year.
The following patient and hospital factors were compiled for multivariate analysis: age, total health encounters, episode-based days, interval procedure type (if any), gender, Elixhauser Comorbidity Index score, type of insurance, race/ethnicity, income (categorized by county-level median household income quartiles), education level (categorized by median county-level rate of less than high school education quintiles), geographic setting of encounter (large metropolitan, small metropolitan, micropolitan, or rural area), and encounter state (Florida or New York). Patients missing any of the abovementioned covariates were excluded as all variables were considered to be missing at random.
Patients with a qualifying index stone event were then separated into those presenting to the ED for potentially avoidable vs unavoidable visits. Potentially avoidable visits were defined as ED visits with a primary or secondary diagnosis of acute urolithiasis that met 1 or more of the following criteria: (1) did not result in subsequent hospital admission, (2) did not result in transfer to another health care facility, or (3) resulted in observation admission without any associated procedure/urological intervention or subsequent admission (eAppendix Table). From this pool of patients, we further restricted our cohort of potentially avoidable encounters to individuals with multiple treat-and-release ED encounters (n > 1) as these individuals should have familiarity with urinary stone–related symptomatology and ambulatory analgesic regimens and in theory have access to ambulatory care triage lines afforded through their initial ED encounter. All other encounters (including index encounters) were defined as unavoidable. We used ICD-10-CM diagnosis codes to identify patients with urolithiasis complicated by urinary tract infection (UTI) (A41, A419, N390) and/or acute kidney injury (AKI) (N17.9, N18, N18x) to further stratify our analyses.
Statistical Analysis
Statistical analyses were performed using Stata release 19 (StataCorp) with a significance level of P < .05. Distribution of covariables between patients experiencing avoidable and unavoidable ED visits for index stone events was examined through comparing medians and IQRs for continuous covariables and proportions for categorical variables. Wilcoxon rank-sum tests for continuous data and Pearson χ 2 tests for categorical data were used as bivariate analysis to assess the initial comparability of the 2 groups. Multivariable logistic regression accounting for facility clustering was performed to demonstrate the association between the aforementioned covariables and presentation for an avoidable encounter.
To understand costs associated with these visits, mean total and index episode costs were computed through merging HCUP data with cost-to-charge ratio files. 18 Mean costs were compared between unavoidable and potentially avoidable urolithiasis-related presentations across full episodes and for individual encounters. After generating initial cost comparisons between avoidable and unavoidable ED visits, a post hoc analysis was performed to examine the impact of the presence of AKI and/or UTI on analyses and assess the validity of our initial criteria, as obstructive urolithiasis in the setting of AKI and/or UTI constitutes indication for urgent urological intervention and thus should be treated in hospital-based settings.19 Progressively more conservative definitions of unavoidable ED visits were generated by reclassifying all patients with concomitant (1) AKI and (2) AKI and/or UTI as unavoidable, based on aforementioned ICD-10-CM diagnosis codes for these conditions. The present study was conducted in accordance with all policies and protocols of the University of North Carolina (UNC) Office of Human Research Ethics and granted exemption by the UNC Institutional Review Board.
We identified 167,102 unique presentations to EDs for urolithiasis, of which 7.9% (n = 13,154) met criteria for being potentially avoidable. Patients in 5.1% of visits (n = 7789) who met criteria for unavoidable presentation required inpatient hospitalization or transfer to an acute care facility. Bivariate differences between the avoidable and unavoidable cohorts are presented in Table 1 [ part A and part B ] . Subgroup analyses for all patients with diagnosed AKI (n = 18,261) found that only 0.9% (n = 173) of presentations met criteria for being potentially avoidable ED presentations, compared with 5.1% (n = 1187) of encounters associated with concomitant UTI (n = 23,060).
In multivariable analyses, factors associated with higher odds of avoidable ED presentation for urolithiasis included receiving care from a small metropolitan facility (small metropolitan vs large metropolitan: odds ratio [OR], 1.87; 95% CI, 1.04-3.37; P = .04) and longer duration between index and subsequent ED visits for urolithiasis (31-60 days vs ≤ 30 days: OR, 2.03; 95% CI, 1.13-3.65; P = .02; > 60 days vs ≤ 30 days: OR, 2.01; 95% CI, 1.30-3.10; P = .002) ( Table 2 [ part A and part B ). Conversely, patient factors protective against avoidable visits included increased number of comorbidities (Elixhauser Comorbidity Index score ≥ 3 vs 0: OR, 0.17; 95% CI, 0.11-0.28; P < .001) and Hispanic ethnicity (Hispanic vs White: OR, 0.51; 95% CI, 0.30-0.88; P = .02) (Table 2).
Mean episode-based costs were similar for unavoidable ($7284; 95% CI, $7035-$7532) vs avoidable ($7200; 95% CI, $7157-$7242) presentations ( P < .001) ( Table 3 and Figure ). Analysis of mean encounter-level costs revealed higher costs associated with unavoidable urolithiasis-related encounters ($5885; 95% CI, $5676-$6093) compared with avoidable encounters ($2098; 95% CI, $2085-$2111) ( P < .001) (Table 3 and Figure). Cumulative annual costs associated with avoidable ED visits for urolithiasis amounted to $94,702,927 for the 2 states studied. Through post hoc analysis, expansion of the definition of unavoidable ED visits to include patients presenting with (1) AKI and (2) AKI and/or UTI reduced the total costs of avoidable ED visits to $91,501,426 and $83,396,849, respectively.
Our findings support growing literature suggesting that the majority of ED presentations for urolithiasis do not result in hospital admission or acute urologic intervention. 8 Likewise, we elucidate that a significant portion of these patients continue to receive hospital-based care in the ED following initial diagnosis without definitive procedural treatment. These findings are timely in the setting of value-based purchasing reforms aimed at maximizing clinical outcomes achieved per dollar expended for condition-specific encounters. Although the treatment of urinary stones is not currently explicitly targeted by alternative payment models (eg, bundled payments), our current findings as well as those of prior studies conducted by this group suggest that the high prevalence of disease and the variability in the intensity and duration of care make urinary stone disease a logical target for the aforementioned reforms. We suggest that transitioning urolithiasis care away from cost-intensive EDs to ambulatory-based clinics, when appropriate, may accrue millions in annual cost savings with minimal impact on clinical outcomes.
Cost analyses demonstrated nearly equivalent total episode-based costs between visits classified as potentially avoidable vs unavoidable ($7200 vs $7284, respectively). However, encounter-level mean costs of potentially avoidable visits were approximately one-third those of unavoidable visits ($2098 vs $5885, respectively). Although these findings are unsurprising as our criteria for classifying visits as potentially avoidable or unavoidable were predicated on cost-incurring outcomes (eg, hospital admission/transfer, urological intervention), repetitive encounters for potentially avoidable ED use drive costs to nearly equivalent levels over an entire care episode. Individual encounter-level costs for potentially avoidable presentations amount to less than one-third of total episode-based costs, whereas individual encounters represent more than 80% of episode-based costs for unavoidable visits. Considering that avoidable stone episodes are made up of multiple lower-cost encounters, we posit that improved outpatient utilization for follow-up encounters may facilitate hospital-based cost containment of more than two-thirds of total costs.
With recent estimates of between $4.4 billion and $8.3 billion spent annually on preventable ED visits in the United States, 20,21 the number of these visits likely contributes significantly to total financial burden. In summing the costs of our final sample of 13,154 potentially avoidable visits, potentially preventable costs amounted to $94,702,927 for these 2 states over 1 calendar year. After post hoc analyses considering more conservative definitions of avoidable ED visits, aggregate costs remained above $80 million. Although associated expenses are not necessarily all preventable, a shift to outpatient care offers the potential for significant cost savings. 5,22 Diagnostic imaging often facilitates workup; however, imaging accounts for only 16% of the costs for episodes of urinary stone disease, 23 leaving ample opportunity for cost reduction. For uncomplicated urinary calculi without indication for admission, outpatient management consists of low-cost, supportive measures including observation, symptom management, straining urine, and α-blocker therapy. 24 Given the natural history of nephrolithiasis, 83% of stones achieve spontaneous passage without intervention. 25
We found that individuals with fewer comorbid conditions experienced higher rates of avoidable visits. Without further analysis, it is unclear whether this association can be attributed to disease severity—assuming patients with higher comorbidity index scores experience severe disease and meet criteria for an unavoidable visit—or whether lower comorbidity scores are a proxy for other patient factors. For example, lower comorbidity scores may represent healthier patients with limited prior exposure to primary care and therefore less familiarity navigating the health care system. Whereas previous literature confirms higher rates of avoidable hospital-based care among the uninsured, who face barriers accessing primary care, 26 our findings did not reproduce previous trends that correlate hospital-based care for ambulatory care–sensitive conditions with low-income populations and economic deprivation. 26
Although prior literature has linked hospital-based care for potentially avoidable emergency admissions to urban areas, 10,27 our findings suggest that nonurban settings carry greater association with avoidable ED use. Previous studies were conducted exclusively in Europe; we expect the United States to have different wealth and facility distribution between urban and rural communities. Although outside the scope of our analysis, we believe this trend holds true for urolithiasis. Our findings may reflect ambulatory care shortages and lack of access to alternative care settings outside the ED in nonurban areas in the United States, concordant with other trends in US rural care such as increases in overall ED utilization in rural areas (despite population decline) and increases in lower-acuity visits in rural EDs. 28 Limited access to observation units in nonurban areas, 29 established geographical barriers to care, 30 and difficulty achieving follow-up care 31 may help contextualize this finding with known urban-rural health disparities. Even with sufficient primary care, these providers may rely on referral to emergency services because of the relative scarcity of urologists in nonurban communities. 32
Elucidating the number of patients with a diagnosis of urolithiasis who seek follow-up care in the ED without hospitalization or procedural intervention and the cost associated with these visits reveals potential for improved outpatient follow-up in this population—an especially important resource given the recurrent nature of urinary calculi. Previous research data have shown that less than 60% of patients who receive a diagnosis of urolithiasis in the ED achieve outpatient follow-up with a primary care physician or urologist within 60 days of discharge, 33 revealing gaps in patients’ ability to access timely outpatient care for urinary stone disease. Burgeoning interventions for ED-based care such as care transition interventions 34,35 and hospital-at-home models 36 may facilitate ambulatory care access for patients who receive a diagnosis of urolithiasis in the ED and help prevent subsequent ED presentations. Our data also support the application of models that divert lower-acuity patients to the outpatient setting: “Discharge to medical home” models of care allow triage of low-acuity ED patients appropriate for ambulatory care to same-day, walk-in appointments with adjacent primary care clinics. 37
Based on recent trends in urology practice, we expect that outpatient management of urinary stone disease will become more available. Even for patients who do not improve with conservative management and require procedural intervention, recent literature demonstrates noninferiority of outpatient extracorporeal shockwave lithotripsy for single ureteric stones compared with ureteroscopy, suggesting the feasibility of shockwave lithotripsy as first-line therapy for select patients. 38 Further, several interventions historically performed in the inpatient setting have proved safe and successful on an outpatient basis, including both flexible ureteroscopy 39 and percutaneous nephrolithotomy. 40 As outpatient management becomes a safer alternative for patients, diverting follow-up care to outpatient settings after initial diagnosis offers an emerging strategy to reduce costs associated with urinary stone disease.
Limitations
It is important to consider these findings in the context of the study’s limitations. The retrospective design obscures temporal relationships, making it difficult to establish causality. Further, our rigid definition of potentially avoidable vs unavoidable ED visits does not capture the nuanced clinical judgment involved in the decision to pursue aggressive inpatient or conservative outpatient management of urinary stone disease. Experts caution against the use of ambulatory care–sensitive conditions as the sole determinant of quality of care. 13 Although the patient/facility factors suggest certain patient sociodemographic populations are more susceptible to using pathways that incur greater costs, these variables do not fully depict the complexity and uniqueness of each patient. Rather, the study provides an estimate of the volume of potentially avoidable ED visits as well as the magnitude of costs incurred by patients and insurers from low-acuity visits. As the data source lacks further information on diagnostic workup and medication use during an encounter, we are unable to exclude patients who did not have an inpatient admission or procedure but did require other services from the ED that would warrant emergency care. For future research, more granular data may allow for further exclusion of patients who require intravenous hydration, intravenous analgesia, or immediate diagnostic workup that would be unavailable in outpatient settings. These data would allow for selection of truly avoidable ED usage from our larger pool of patients with potentially avoidable ED presentation.
Although the total costs suggest potential cost savings, we have not accounted for the cost of replacing these services with ambulatory-based treatment, which would detract from cost savings. Although the use of emergency services magnifies costs for stone episodes, use of imaging in diagnosis represents a barrier to lowering cumulative costs of this condition. Nevertheless, these findings offer important insight into the associated costs of urolithiasis care through the ED, particularly in the context of burgeoning advances in value-based payment models, which may offer promising incentives for providers to utilize increasingly available ambulatory-based care.
CONCLUSIONS
Our study elucidates various patient clinical and sociodemographic factors associated with higher rates of potentially avoidable ED presentation for urolithiasis, which may suggest specific populations that may benefit from facilitated access to outpatient care following initial diagnosis. Regardless of the factors influencing patients’ decision to pursue emergency care, we propose that these results substantiate the value of recent trends in the field to expand availability of outpatient procedural interventions for stone extraction. Avoidable ED visits contribute millions of dollars to annual health care expenditures in the 2 states studied. Given that more than 80% of costs associated with episodes of urinary stone disease in the ED are accrued from spending outside diagnostic imaging, 23 we assert that our proposed cost-saving measures have the potential to alleviate significant financial burden. It is paramount that we address avoidable ED presentations to reduce ED saturation and control the rising costs of US health care.
Author Affiliations: Department of Urology, University of North Carolina Medical Center (SJC, OD, JF, MEN, DFF), Chapel Hill, NC; Departments of Surgery (Urology) and Population Health Science, Duke Clinical Research Institute, Duke University Medical Center (CDS), Durham, NC.
Source of Funding: Dr Friedlander is supported by an American Urological Association Early Career Investigator Research Scholars Award.
Author Disclosures: The authors report no relationship or financial interest with any entity that would pose a conflict of interest with the subject matter of this article.
Authorship Information: Concept and design (SJC, OD, CDS, DFF); acquisition of data (OD, DFF); analysis and interpretation of data (SJC, CDS, MEN, DFF); drafting of the manuscript (SJC, OD, JF, DFF); critical revision of the manuscript for important intellectual content (SJC, OD, JF, CDS, MEN, DFF); statistical analysis (SJC, DFF); provision of patients or study materials (DFF); obtaining funding (DFF); administrative, technical, or logistic support (SJC, JF, MEN, DFF); and supervision (CDS, DFF).
Address Correspondence to: David F. Friedlander, MD, MPH, Department of Urology, University of North Carolina at Chapel Hill, POB 170 Manning Dr, CB# 7235, Chapel Hill, NC 27599-7235. Email: [email protected].
1. Table 14-47. Economic impact of urologic disease. In: Litwin MS, Saigal CS, eds. Urologic Diseases in America . HHS, Public Health Service, National Institutes of Health, National Institute of Diabetes and Digestive and Kidney Diseases; 2012:486. NIH publication No. 12-7865.
2. Hyams ES, Korley FK, Pham JC, Matlaga BR. Trends in imaging use during the emergency department evaluation of flank pain. J Urol . 2011;186(6):2270-2274. doi:10.1016/j.juro.2011.07.079
3. Gottlieb M, Long B, Koyfman A. The evaluation and management of urolithiasis in the ED: a review of the literature. Am J Emerg Med . 2018;36(4):699-706. doi:10.1016/j.ajem.2018.01.003
4. Fulgham PF, Assimos DG, Pearle MS, Preminger GM. Clinical effectiveness protocols for imaging in the management of ureteral calculous disease: AUA technology assessment. J Urol . 2013;189(4):1203-1213. doi:10.1016/j.juro.2012.10.031
5. Friedlander DF, Krimphove MJ, Cole AP, et al. Care setting as a modifiable predictor of perioperative cost and outcomes following elective urinary stone surgery. Urol Pract . 2020;7(4):259-265. doi:10.1097/UPJ.0000000000000107
6. Favus MJ, Feingold KR. Kidney stone emergencies. In: Feingold KR, Anawalt B, Boyce A, et al, eds. Endotext . MDText.com, Inc; 2018. Accessed October 23, 2023. https://www.ncbi.nlm.nih.gov/books/NBK278956/
7. Caldwell N, Srebotnjak T, Wang T, Hsia R. “How much will I get charged for this?” patient charges for top ten diagnoses in the emergency department. PLoS One . 2013;8(2):e55491. doi:10.1371/journal.pone.0055491
8. Schoenfeld EM, Pekow PS, Shieh MS, Scales CD Jr, Lagu T, Lindenauer PK. The diagnosis and management of patients with renal colic across a sample of US hospitals: high CT utilization despite low rates of admission and inpatient urologic intervention. PLoS One . 2017;12(1):e0169160. doi:10.1371/journal.pone.0169160
9. Brown J. Diagnostic and treatment patterns for renal colic in US emergency departments. Int Urol Nephrol . 2006;38(1):87-92. doi:10.1007/s11255-005-3622-6
10. Lynch B, Fitzgerald AP, Corcoran P, Buckley C, Healy O, Browne J. Drivers of potentially avoidable emergency admissions in Ireland: an ecological analysis. BMJ Qual Saf . 2019;28(6):438-448. doi:10.1136/bmjqs-2018-008002
11. Clubbs Coldron B, MacRury S, Coates V, Khamis A. Redefining avoidable and inappropriate admissions. Public Health . 2022;202:66-73. doi:10.1016/j.puhe.2021.11.004
12. Billings J, Parikh N, Mijanovich T. Emergency department use: the New York story. Issue Brief (Commonw Fund) . 2000;(434):1-12.
13. Hodgson K, Deeny SR, Steventon A. Ambulatory care-sensitive conditions: their potential uses and limitations. BMJ Qual Saf . 2019;28(6):429-433. doi:10.1136/bmjqs-2018-008820
14. Agarwal R, Liao JM, Gupta A, Navathe AS. The impact of bundled payment on health care spending, utilization, and quality: a systematic review. Health Aff (Millwood) . 2020;39(1):50-57. doi:10.1377/hlthaff.2019.00784
15. SEDD overview. Healthcare Cost and Utilization Project. September 2021. Accessed October 23, 2023. https://www.hcup-us.ahrq.gov/seddoverview.jsp
16. Friedlander DF, Krimphove MJ, Cole AP, et al. Care setting as a modifiable predictor of perioperative cost and outcomes following elective urinary stone surgery. Urol Pract . 2020;7(4):259-265. doi:10.1097/UPJ.0000000000000107
17. French WW, Scales CD, Viprakasit DP, Sur RL, Friedlander DF. Predictors and cost comparison of subsequent urinary stone care at index versus non-index hospitals. Urology . 2022;164:124-132. doi:10.1016/j.urology.2022.01.023
18. Klabunde CN, Potosky AL, Legler JM, Warren JL. Development of a comorbidity index using physician claims data. J Clin Epidemiol . 2000;53(12):1258-1267. doi:10.1016/s0895-4356(00)00256-0
19. Assimos D, Krambeck A, Miller NL, et al. Surgical management of stones: American Urological Association/Endourological Society Guideline, part II. J Urol . 2016;196(4):1161-1169. doi:10.1016/j.juro.2016.05.091
20. Daly R. Preventable ED use costs $8.3 billion annually: analysis. Healthcare Financial Management Association. February 11, 2019. Accessed December 13, 2021. https://www.hfma.org/topics/news/2019/02/63247.html
21. Weinick RM, Burns RM, Mehrotra A. Many emergency department visits could be managed at urgent care centers and retail clinics. Health Aff (Millwood) . 2010;29(9):1630-1636. doi:10.1377/hlthaff.2009.0748
22. Roberson D, Sperling C, Shah A, Ziemba J. Economic considerations in the management of nephrolithiasis. Curr Urol Rep . 2020;21(5):18. doi:10.1007/s11934-020-00971-6
23. Medicare Payment Advisory Commission. Table 4-2: share of total dollars spent on imaging (all modalities), 2005. In: Report to the Congress: Improving Incentives in the Medicare Program . Medicare Payment Advisory Commission; 2009:91. Accessed October 23, 2023. https://www.medpac.gov/wp-content/uploads/import_data/scrape_files/docs/default-source/reports/Jun09_EntireReport.pdf
24. Curhan GC, Aronson MD, Preminger GM. Kidney stones in adults: diagnosis and acute management of suspected nephrolithiasis. UpToDate. Updated August 10, 2023. Accessed January 14, 2022. https://www.uptodate.com/contents/kidney-stones-in-adults-diagnosis-and-acute-management-of-suspected-nephrolithiasis
25. Miller OF, Kane CJ. Time to stone passage for observed ureteral calculi: a guide for patient education. J Urol . 1999;162(3 Pt 1):688-691. doi:10.1097/00005392-199909010-00014
26. Wallar LE, De Prophetis E, Rosella LC. Socioeconomic inequalities in hospitalizations for chronic ambulatory care sensitive conditions: a systematic review of peer-reviewed literature, 1990-2018. Int J Equity Health . 2020;19(1):60. doi:10.1186/s12939-020-01160-0
27. O’Cathain A, Knowles E, Maheswaran R, et al. A system-wide approach to explaining variation in potentially avoidable emergency admissions: national ecological study. BMJ Qual Saf . 2014;23(1):47-55. doi:10.1136/bmjqs-2013-002003
28. Greenwood-Ericksen MB, Kocher K. Trends in emergency department use by rural and urban populations in the United States. JAMA Netw Open . 2019;2(4):e191919. doi:10.1001/jamanetworkopen.2019.1919
29. Greenwood-Ericksen MB, Macy ML, Ham J, Nypaver MM, Zochowski M, Kocher KE. Are rural and urban emergency departments equally prepared to reduce avoidable hospitalizations? West J Emerg Med . 2019;20(3):477-484. doi:10.5811/westjem.2019.2.42057
30. Fraze TK, Lewis VA, Wood A, Newton H, Colla CH. Configuration and delivery of primary care in rural and urban settings. J Gen Intern Med . 2022;37(12):3045-3053. doi:10.1007/s11606-022-07472-x
31. Toth M, Holmes M, Van Houtven C, Toles M, Weinberger M, Silberman P. Rural Medicare beneficiaries have fewer follow-up visits and greater emergency department use postdischarge. Med Care . 2015;53(9):800-808. doi:10.1097/MLR.0000000000000401
32. Odisho AY, Fradet V, Cooperberg MR, Ahmad AE, Carroll PR. Geographic distribution of urologists throughout the United States using a county level approach. J Urol . 2009;181(2):760-766. doi:10.1016/j.juro.2008.10.034
33. Schoenfeld EM, Shieh M, Pekow PS, Scales CD, Munger JM, Lindenauer PK. Association of patient and visit characteristics with rate and timing of urologic procedures for patients discharged from the emergency department with renal colic. JAMA Netw Open . 2019;2(12):e1916454. doi:10.1001/jamanetworkopen.2019.16454
34. Seidenfeld J, Ramos K, Bruening RA, Sperber NR, Stechuchak KM, Hastings SN. Patient experiences of a care transition intervention for veterans to reduce emergency department visits. Acad Emerg Med . 2023;30(4):388-397. doi:10.1111/acem.14661
35. Edgren G, Anderson J, Dolk A, et al. A case management intervention targeted to reduce healthcare consumption for frequent emergency department visitors: results from an adaptive randomized trial. Eur J Emerg Med . 2016;23(5):344-350. doi:10.1097/MEJ.0000000000000280
36. Paulson MR, Eldaly AS, Avila FR, et al. Small bowel obstruction conservatively managed in hospital-at-home. Case Rep Gastrointest Med . 2022;2022:1969040. doi:10.1155/2022/1969040
37. Zager K, Taylor YJ. Discharge to medical home: a new care delivery model to treat non-urgent cases in a rural emergency department. Healthc (Amst) . 2019;7(1):7-12. doi:10.1016/j.hjdsi.2018.08.001
38. Dasgupta R, Cameron S, Aucott L, et al. Shockwave lithotripsy versus ureteroscopic treatment as therapeutic interventions for stones of the ureter (TISU): a multicentre randomised controlled non-inferiority trial. Eur Urol . 2021;80(1):46-54. doi:10.1016/j.eururo.2021.02.044
39. Bosquet E, Peyronnet B, Mathieu R, et al. Faisabilité de l’urétéroscopie souple en ambulatoire pour la prise en charge des calculs urinaires: une étude rétrospective monocentrique. Abstract in English. Prog Urol . 2017;27(16):1043-1049. doi:10.1016/j.purol.2017.07.246
40. Bechis SK, Han DS, Abbott JE, et al. Outpatient percutaneous nephrolithotomy: the UC San Diego Health experience. J Endourol . 2018;32(5):394-401. doi:10.1089/end.2018.0056

Following Roe v Wade Overturn, Research Focuses on Male Contraceptives
Stephanie T. Page, MD, PhD, UW Medicine Diabetes Institute, presented on ongoing research and growing interest in new male contraceptive options, such as an oral pill and a hormonal transdermal gel, at the American Urological Association 2024 Annual Meeting.

Updates on Adagrasib in CRC and the Importance of Genomic Testing With Dr Jun Gong
Jun Gong, MD, of Cedars-Sinai Medical Center, discusses the latest data on adagrasib in colorectal cancer, the importance of conducting genomic testing, and more.

Dr Arti Masturzo Gives an In-Depth Look at CCS Survey Results Showing Misconceptions Around Diabetes Management
Survey results from more than 1500 patients with diabetes revealed that 57% believed glucagon-like peptide-1 (GLP-1) weight loss drugs alone could be a "silver bullet" for managing their health goals.
Managed Care Cast Presents: Insights Into Precision Medicine in NSCLC
In this podcast, a trio of experts discuss precision medicine in non–small cell lung cancer (NSCLC), current immunotherapies, and more.
Access Denied: CMS’ Action Hurts Patients With Cancer in Rural America
CMS rules hindered the access of rural patients with cancer to medically integrated pharmacies in 2023. The authors discuss the impact on equity in health care, emphasizing the need for regulatory change.

TAR-210 Shows Promise in Treating NMIBC With Select FGFR Alterations; Updates on MoonRISe-1
The novel intravesical drug delivery system releases erdafitinib locally within the bladder while limiting systemic toxicities.
2 Commerce Drive Cranbury, NJ 08512
609-716-7777

COMMENTS
'Avoidable' ER Visits Fuel Health Care Costs. ... "The average cost of treating common primary care treatable conditions at a hospital ED is $2,032," the analysis says, which is "12 times ...
The average cost of treating common primary care treatable conditions at a hospital ED is $2,032, according to UnitedHealth Group. That number is 12 times higher than visiting a physician office ($167) and 10 times higher than traveling to an urgent care center ($193) to treat those same conditions. In other words, visiting either a physician ...
That translates to $2,032 on average compared to $167. That same trip is also 10 times higher than a visit to urgent care, which on average costs $193. This can be a crucial difference in Texas, where patients continue to be confused between urgent care clinics and the states' hundreds of free-standing emergency rooms, health analysts say.
Avoidable ED visits place a huge burden on the healthcare system, including rising costs and ED overcrowding . It is estimated that preventing unnecessary ED visits could provide a cost savings of approximately $4.4 billion annually in the United States [ 4 ].
The estimated cost of unnecessary ED care has nearly doubled from a 2010 estimate. Feb. 8—An estimated $8.3 billion is spent each year on emergency department (ED) care that could be provided in another location, according to a new analysis. The preventable spending on unnecessary visits by 17 percent of ED patients was identified by Premier and marked a significant increase from the $4.4 ...
Emergency department visits (both preventable and non-preventable) cost $76.3 billion in the United States in 2017, according to ... Lack of health insurance coverage was another factor that appeared to play a role in preventable ER visits. According to the study, individuals without health insurance had more preventable visits to the ER than ...
ED visits for conditions that are preventable or treatable with appropriate primary care lower health system efficiency and raise costs ( Enard & Ganelin, 2013 ). An estimated 13% to 27% of ED visits in the United States could be managed in physician offices, clinics, and urgent care centers, saving $4.4 billion annually ( Weinick, et al., 2010 ).
Anywhere from 13 percent to 70 percent of those visits were potentially avoidable. These visits cost insurance payers and self-funded employers billions of dollars each year. Unnecessary ER utilization can also negatively impact those seeking emergency care. It increases wait times and can expose people to infectious diseases in overcrowded ...
These preventable, or avoidable, ED visits place a strain on ED capacity and have high costs—an estimated $8.3 billion per year, according to a 2019 analysis by Premier. 1 However, the term ...
Introduction. Avoidable emergency department (ED) visits put significant strain on the healthcare system by increasing overall cost and leading to ED overcrowding 1, 2.This problem has received more attention in the US in recent years due to significant increases in annual ED visits and reductions in ED admission rates among the elderly, the Medicare-reimbursed, and patients with multiple ...
Aggregate ED visit costs totaled $76.3 billion in the United States in 2017, encompassing 144.8 million ED visits with an average cost per visit of $530. Routine discharge was the most frequent disposition from the ED, representing 80.8 percent of aggregate ED costs and a similar share of ED visits.
UnitedHealth: Healthcare could save $32B annually by diverting avoidable ED visits By Jacqueline Renfrow Jul 22, 2019 11:44am Emergency Care Healthcare Costs Physician Practice Primary Care
This visualization depicts both counts and rates of emergency department visits from 2016-2021 for the 10 leading primary diagnoses and reasons for visit, stratified by selected patient and hospital characteristics. Rankings for the 10 leading categories were identified using weighted data from 2021 and were then assessed in prior years ...
Two-thirds of hospital ED visits annually by privately insured individuals in the U.S. - 18 out of 27 million** - are avoidable. These patients can be treated safely and e˛ectively in high-quality, low-cost primary care settings.2 Higher costs at hospital EDs are driven in part by: Hospital facility fees, which increase the cost of an
In 2010, nearly 1 in 5 visits were determined to be potentially avoidable and contributed $65 billion to rising health care costs and ED overcrowding. 3 The average cost of treating common primary ...
centers; the average cost di˛erence was applied to the number of avoidable ED visits by privately insured individuals to estimate potential annual savings. UnitedHealthcare analysis conducted in 2019 of U.S. commercial claims from 2018. UnitedHealthcare analysis, 2019. Visits classi˜ied according to the the New York University ED algorithm:
Reducing unnecessary emergency department (ED) visits should be a goal of all primary care and specialty practices. Although the definition of what we consider "unnecessary" may be subject to interpretation, we generally include visits that could have been handled in a different setting as well as visits that could have been avoided through
In this study, the authors examined 80.6 million outpatient ED visits from the Healthcare Cost and Utilization Project State Emergency Department Databases and a difference-in-differences design to evaluate changes in the rate of outpatient ED use in 2 Medicaid expansion states (New York and Massachusetts) vs 2 nonexpansion states (Georgia and ...
anywhere from 30 -70% of ED visits are potentially avoidable. Research studies on avoidable ED visits for specific settings below: • Nursing Homes: Appropriateness of transferring nursing home residents to emergency departments: a systemic review/ January 2019 • Clinic/Office: CMS TCPi Reducing Unnecessary Emergency Department Visits
Avoidable emergency department visits were lower in value-based care than in fee-for-service as well, with 21 visits per 1,000 beneficiaries in the former models and 26.8 in the second model.
ditions, achieve cost-neutrality with the lowest number of averted visits to the ED. To achieve cost-neutrality, 4-5 visits to the ED would need to be averted per year by a CHW assigned a panel of 70 patients with uncontrolled hypertension or congestive heart failure— approximately 3%-4% of typical ED visits among such patients, respectively.
A plan of action to reduce avoidable ED visits. In our latest blog series, we'll be taking a look at how the ACG System's suite of tools can be used to understand emergency department (ED) visits and in turn, optimize health care utilization and reduce potential costs. If you read last week's blog, you know that the ACG System can reveal ...
Results: Of the 167,102 ED encounters for urolithiasis, 7.9% were potentially avoidable, totaling $94,702,972 in potential yearly cost savings. Mean encounter-level costs were higher for ...